This Graph Says It All
And somehow…
This is kind of another level.
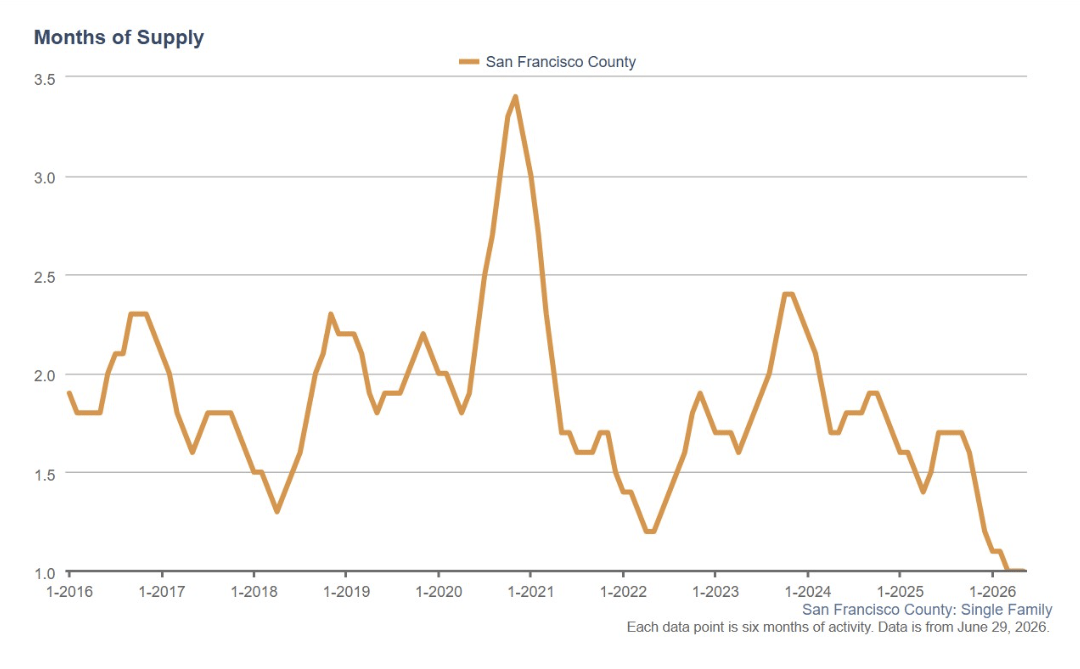
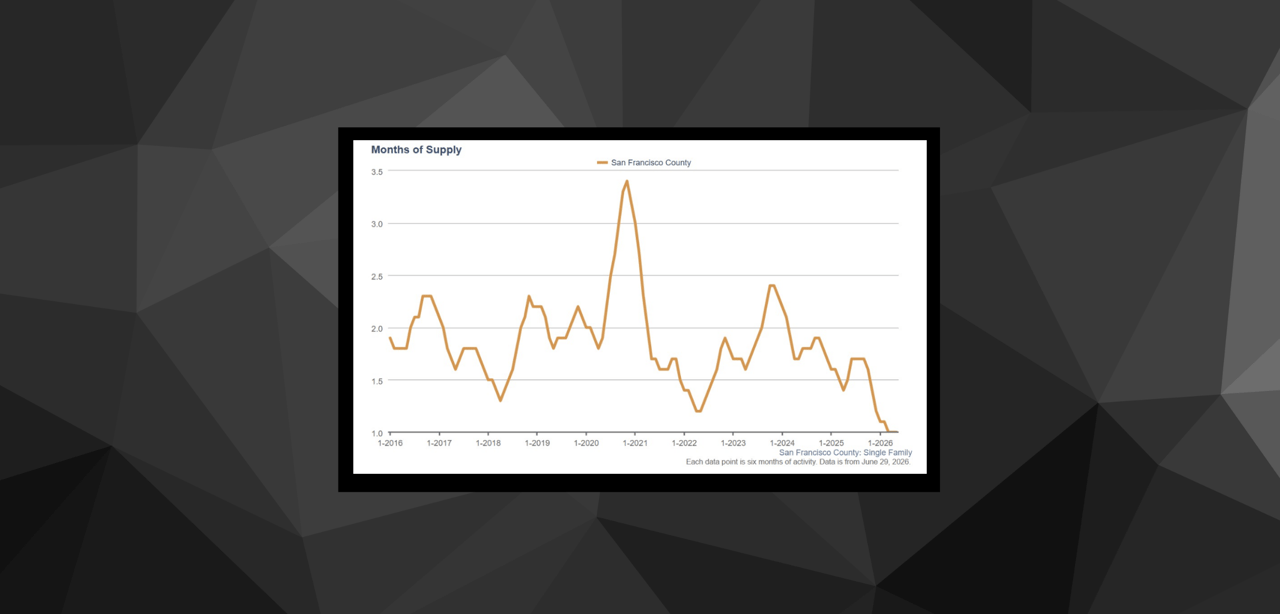
As you can see from the chart above, single family home inventory in San Francisco is bottoming out. This shows the last 10 years but going back even 20 - inventory has never been this scarce.
Months worth of inventory is one of the most helpful real estate metrics, since it measures both supply and demand. It tells us the number of months it would take to sell every home currently up for sale, if no new homes hit the market. Absorption rate, if you will.
Our market starts to feel balanced(ish) at around 3 months of inventory (which we rarely see for single family homes). Right now the rolling 6 month average is at 1 month. Month-to-month data shows a dip to 0.6 months in December 2025.
So when it comes to what's happening in the market, the snapshot of inventory kind of says it all. Single family home buyers are getting exhausted, and the upward pricing trend continues.
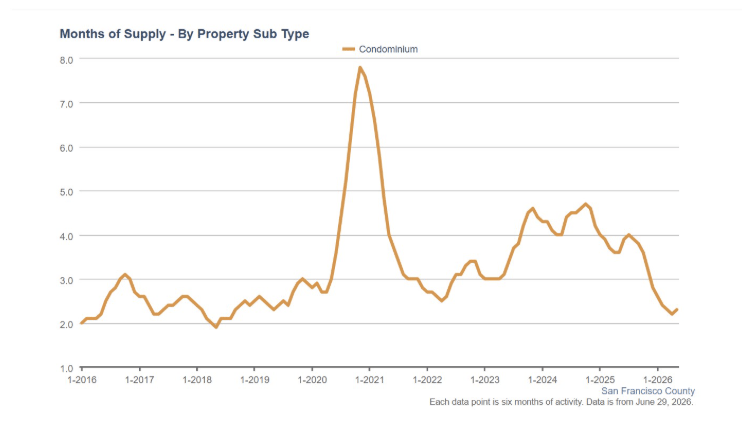
How about condos?
Oh, we're glad you asked. Condos are hovering right around 2 months, which is very low by most US markets' standards, but in the range of normal for San Francisco. More or less pre-COVID status.
If you're thinking of making a move, it's rarely been a more opportune time.
You know where to find us!
Stay up to date on the latest real estate trends.
Here in SF we're no stranger to hot markets. Heck, we straight up define what a hot market is in the US. No one does multiple offers and packed open houses like we do … Read more

Whether your dog is your favorite hiking companion or your cat is convinced they own the house (they probably do), we all want the same thing—to give our pets the happ… Read more

Why Buyer-Agent Monogamy is a Win-Win for All






You’ve got questions and we can’t wait to answer them.